Following the announcement of the Airtripper Extruder Filament force sensor I found a bit of time to run a few tests and to plot a few graphs to find out if the load cell is not just a fancy 3d printer add-on. Enough graphs and explanations have been added below to help you decide whether the load cell add-on make for a serious bit of kit or it’s just a waste of time. But before we get into the graphs, we’ll start with the introduction to the Airtripper Extruder Filament Force Sensor; with images to boot.
This is a project with a lot details to cover so there will be three articles including this one. This article is about selling the idea, then the next article will be be about the load cell bracket construction. The last article will then cover the electronics with load cell calibration and software interface. I would advise not to go out and buy the load cell or supporting electronics until advised by this project. This is just to make sure that your load cell will get the best start for successful calibration.
Airtripper Extruder Filament Force Sensor
Airtripper’s Load Sensitive 3D Printer Filament Extruder Using A 5KG Scale Load Cell
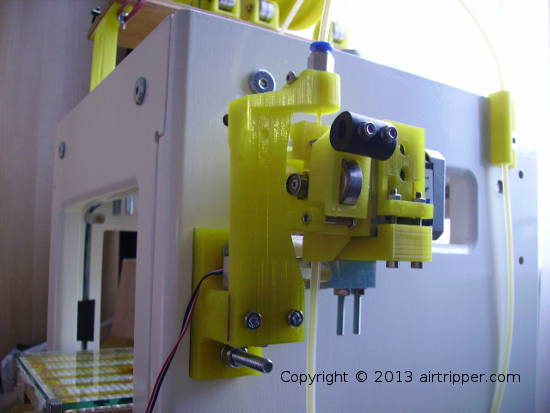
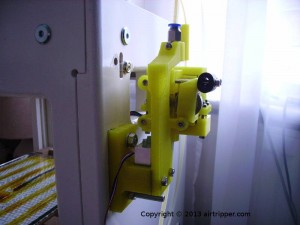
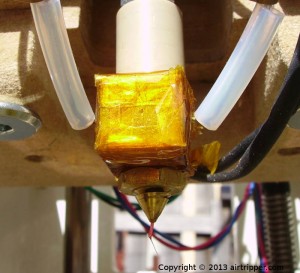
You probably get an idea of how this Airtripper load sensitive extruder works by looking at the picture above. I don’t expect it will look great on every 3d printer but it looks good on mine and I shall be fitting a second one soon. The attachment footprint is small which should suit many 3d printer set-ups. All the load sensor bracket components have been designed to provide good stiffness to the complete assembly. More details about the bracket assembly and other options will be covered in the next article.
Airtripper Extruder Filament Force Sensor
How It Works. It is basically an Airtripper bowden extruder that is attached to one end of the load cell. When the extruder feeds the filament to the hot end, the extruder is effectively pushing against the filament causing the extruder to apply extra load on the load cell. Load cells have strain gauges attached that change in electrical resistance when under different loads. This resistance change provides small voltage levels that can be amplified and then read by an analogue to digital converter. In this project, an Arduino Uno is used to read the analogue output from an instrumental amplifier. The readings taken from the load cell are linear which makes it easy to create an accurate weight table in the Arduino Coding.
Because of the stiffness of the load cell and the brackets, printer wobble has very little influence of the final sensor readings. Any operational lag in the assembly is likely to be much less than the combination of stretching and compression of the bowden extruder system. You’ll notice in the picture above there is a filament guide tube fitted between the extruder and the filament real. This filament tube guide prevents the extruder pulling down on to the load cell when tugging at the filament reel; skewing sensor readings.
Airtripper Extruder Filament Force Sensor Graphs
Set Of 3 3d printed 608-ZZ Ball Bearing Axles
Basically, the purpose of doing these graphs is to find out what sort of information we can get out of the load cell that is used for the filament force sensor. We want to find out if the graphs can be used as a guide for better extruder set-ups. The graphs below is just a start and not a complete test of every set-up situation.
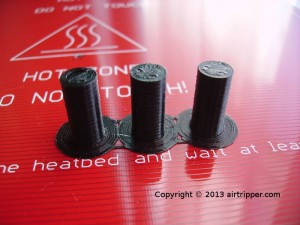
Some Test Conditions. I used the same test print object for all the graphs below accept for graph twelve. The test print object is a set of three bearing axles used on the Airtripper’s Bowden Extruder.
Skeinforge was used to compile the g-code for each test while Pronterface was used to interface with the Marlin Firmware on the Sumpod. It should be noted that the temperature used in the tests below is the temperature of the nozzle heater block and that the nozzle temperature could be much lower.
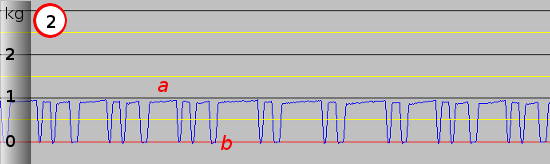
Graph One
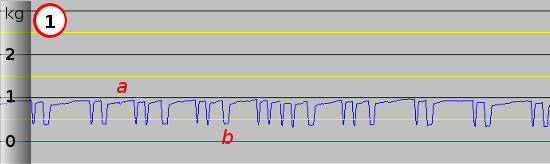
Flow/Feed Rate (mm/s) = 24, Temperature (C) = 220, Extruder Retraction Speed (mm/s) = 13.3, Retraction Distance (mm) = 0.8, Restart Extra Distance (mm) = 0.
Graph one is a plot of what was my typical set-up for months. The 3d printed outputs were good but a bit of cleaning was needed to get rid of the many fine hairs and the odd clumps of plastic.
a The load sensor shows that a consistent pressure is maintained with the current settings, however, there is a slight climb in pressure after each retraction. b The retraction was not long enough to fully de-pressurise the hot end nozzle which caused some pressure to be lost from the nozzle tip through extrusion. Unwanted extrusion usually causes stringing and clumps of plastic to be left between object cavities and perimeters.
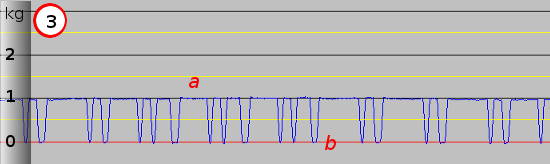
Graph Two
Flow/Feed Rate (mm/s) = 24, Temperature (C) = 220, Extruder Retraction Speed (mm/s) = 13.3, Retraction Distance (mm) = 2.0, Restart Extra Distance (mm) = 0.
b Retraction is increased to 2mm and the change is reflected in graph two. The retraction is long enough to drop the pressure to 0kg but the consistent pressure maintained across the graph a still shows a slight climb after each retraction b.
Retraction was long enough to relax the filament in the bowden extruder system but not long enough to pull the filament from the nozzle tip. Some oozing may have occurred to cause a slight loss of pressure. Graph two looks better than graph one because of the signs of less pressure being lost between retractions.
Graph Three
Flow/Feed Rate (mm/s) = 24, Temperature (C) = 220, Extruder Retraction Speed (mm/s) = 13.3, Retraction Distance (mm) = 2.0, Restart Extra Distance (mm) = 0.1.
Using the same settings as graph two but using Restart Extra Distance of 0.1mm, the graph shows a consistent pressure level across the graph a and also in between retractions b. You will notice that all the retractions b are hitting the 0kg mark consistently. The width of the retraction indicates travel period between plastic filament extrusion.
This demonstrates the sensitivity and the consistency of the load sensor. Adding Restart Extra Distance will add more plastic to the 3d print and alter some dimensions.
Graph Four
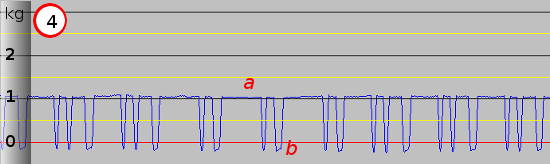
Flow/Feed Rate (mm/s) = 24, Temperature (C) = 220, Extruder Retraction Speed (mm/s) = 25.0, Retraction Distance (mm) = 3.0, Restart Extra Distance (mm) = 0.
With this test I have altered a few more settings (shown in bold red above) since graph three. The main change to note is that we now have a Retraction Distance of 3mm. This has brought the retractions b to well below the 0kg mark. Each retraction shown in the graph is consistent in length and the pressure a has maintained a consistent level between retractions and across the graph.
The effect of this change now means that the filament is pulled from the nozzle tip; preventing pressure loss caused by melted plastic oozing from the nozzle tip. The Extruder Retraction Speed setting is almost doubled to reduce the retraction operating time between plastic extrusion.
This has provided the best set-up for my 3d printer, no oozing and no strings. I was able to print a tray of different objects without loss of quality to object walls; no 3d printed parts clean up was needed. A lot of time saved on production runs.
Graph Five
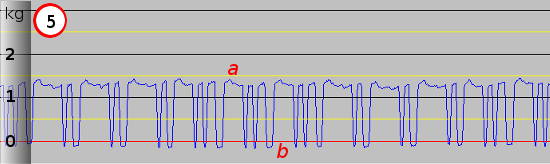
Flow/Feed Rate (mm/s) = 48, Temperature (C) = 220, Extruder Retraction Speed (mm/s) = 25.0, Retraction Distance (mm) = 3.0, Restart Extra Distance (mm) = 0.
Flow Rate and Feed Rate are both doubled to a setting of 48mm/s but all the other settings remain the same as the previous graph. Because the parts being printed for this test are small the printer would not make the 48mm/s speed. However, speed is increased and is reflected in the graph as an increase in pressure compared to the last graph a.
Although the pressure is nicely maintained across the graph, pressure ripple a has appeared as a result of increased speed. All the wider peaks a look to have a similar patten which would suggest that this is caused by a control feature of the firmware as a result of printing a small part at a higher speed. Although the pressure has increased the retractions b still make it below 0kg and the retraction length remains consistent across the graph.
Despite the ripples the graph still looks pretty neat and tidy and as uniform as the previous graph that had good print results. This faster setting also produced the same good print results.
Force Sensor / Load Cell Temperature Detection Test
The following graphs from six to eleven is about what difference the temperatures makes to the force sensor / load cell readings.
Graph Six
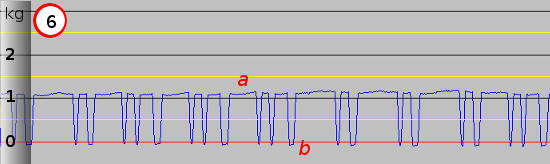
Flow/Feed Rate (mm/s) = 24, Temperature (C) = 215, Extruder Retraction Speed (mm/s) = 20.0, Retraction Distance (mm) = 2.5, Restart Extra Distance (mm) = 0.
220 degrees C looks to be the best setting for my 3d printer set-up and may get away with 215 degrees C as shown in the above graph. The temperature decrease as shown a slight increase in pressure a and a slight variance in pressure across the graph. The length of the retraction b shown in the graph look less consistent.
Graph Seven
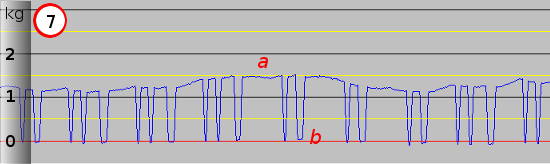
Flow/Feed Rate (mm/s) = 24, Temperature (C) = 210, Extruder Retraction Speed (mm/s) = 20.0, Retraction Distance (mm) = 2.5, Restart Extra Distance (mm) = 0.
With a lower temperature of 210 degrees C there is an obvious pressure wave showing in the graph a. Despite this wave, each retraction b is still hitting around 0kg and looking a lot less consistent in length. The lower temperature setting is now plotting a graph that is now a lot less uniform.
Graph Eight
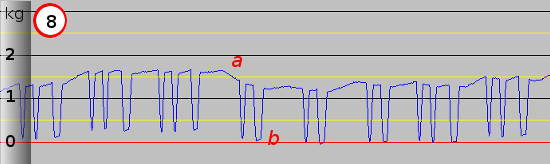
Flow/Feed Rate (mm/s) = 24, Temperature (C) = 205, Extruder Retraction Speed (mm/s) = 13.3, Retraction Distance (mm) = 2.0, Restart Extra Distance (mm) = 0.
With the temperature lowered again the load cell is detecting higher pressure a and also the pressure wave that was shown in the last graph. The Retraction Distance setting is reduced to 2mm and the graph now shows a pressure wave on retractions b similar to the upper pressure wave a. The wider peaks between retractions are now showing indications of sharp rise or sharp falls in pressure.
The walls are looking a bit less evenly printed on the test parts now, but no real signs of major print disaster.
Graph Nine
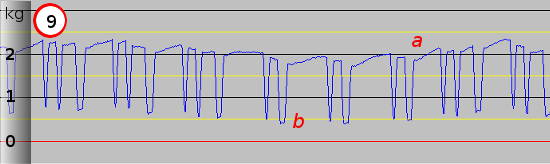
Flow/Feed Rate (mm/s) = 24, Temperature (C) = 195, Extruder Retraction Speed (mm/s) = 13.3, Retraction Distance (mm) = 2.0, Restart Extra Distance (mm) = 0.
At a temperature of 195 degrees C the pressure is now detected by the load cell at well over 2kg. The above graph shows similar characteristics as graph Eight.
Graph Ten
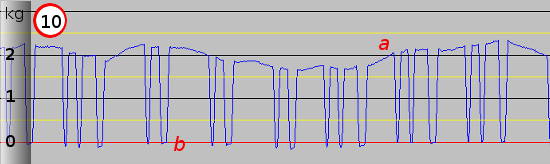
Flow/Feed Rate (mm/s) = 24, Temperature (C) = 195, Extruder Retraction Speed (mm/s) = 25.0, Retraction Distance (mm) = 4.0, Restart Extra Distance (mm) = 0.
The Retraction Distance is adjusted keeping the same temperature as the previous graph. The retractions b are now hitting around the 0kg mark and no longer matching the pressure wave of the higher peaks a between retractions. The retraction length shown in the graph are now not consistent across the graph.
Graph Eleven
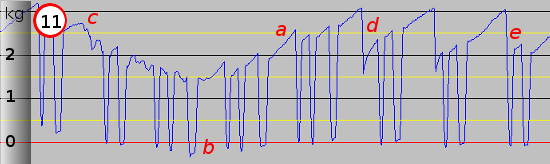
Flow/Feed Rate (mm/s) = 24, Temperature (C) = 185, Extruder Retraction Speed (mm/s) = 25.0, Retraction Distance (mm) = 4.0, Restart Extra Distance (mm) = 0.
This is where everything goes a bit pear shaped. The temperature is lowered to 185 degrees C and the pressure peaks at above 3kg as detected by the load cell. The graph is looking a bit distorted because the extruder drive gear has reached it’s filament pushing power limits due to the higher pressure. The test parts failed to print properly under these conditions which was mostly due to filament slippage.
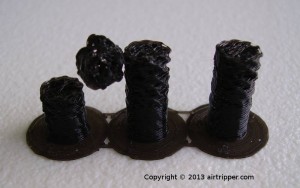
Set Of Three 608-ZZ Ball Bearing Axles. Graph 11 test subject
The graph shows indications of filament slippage c and stepper motor stalls d, e. Stepper motor stalls produce a knocking sound and so is easily detected without the aid of the force sensor. Filament slippage is a lot more difficult to detect but can be seen easily on the graph at point c. The filament slippage seems to continue until a lower pressure is reached where the stepper drive gear can move the filament and get a fresh grip; forcing the pressure to go up again.
Sometimes stepper motor stalls look like retractions like at point e on the graph. At point e a retraction happened just inside a stepper motor stall and we know this because the pressure dropped to 0kg and the retraction return did not fully recover. From the settings above we know that the retraction start and return points should be at around the same pressure level.
Graph Twelve
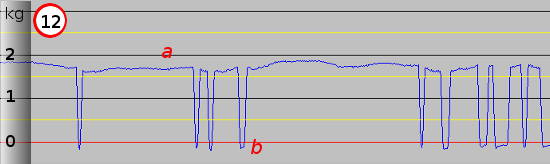
Flow/Feed Rate (mm/s) = 48, Temperature (C) = 220, Extruder Retraction Speed (mm/s) = 25.0, Retraction Distance (mm) = 4.0, Restart Extra Distance (mm) = 0.
Graph twelve sees a return temperature of 220 degrees C and the Flow Rate and Feed Rate of 48mm/s. But this time we a printing a larger part to encourage a faster print speed.
While comparing to graph Five we have achieved a higher pressure level a and still maintaining consistent retractions that drop below 0kg b. The print still looks as good and you don’t get the pressure wave as shown in graph eight with similar pressure levels.
Conclusion
The Graphs. Since adding the filament force sensor to the bowden extruder the 3d printer is now outputting it’s best print runs. The graphs have played an important role to identify the best extruder set-up, for the first time I have real feedback to work with.
The graphs above are typical of the test part I chose to print and it is important to note that printing more complex objects could produce graphs that look very different. The pressure level will not always be the same across the graph for some 3d prints and this can be due to the firmware printing at varying speeds. Infill is usually printed faster than the perimeters so higher nozzle pressure will be detected during infill printing.
A good graph such as graphs 1 to 5 show a good measure of control over the extruder operation. Settings in the g-code are detected accurately and there is good consistency showing across the graph. Achieving this type of graph from the bowden set-up delivers the best print results.
Graphs 7 to 11 shows how things start to get messed when hot end nozzle temperature is gradually reduced. Pressure waves form across the graphs and retraction lengths become less consistent. In a more serious case of low temperature the extruder load cell (used as a filament force sensor) was able to detect filament slippage and also stepper motor stalls.
V9 Hot End Clone Heater And Nozzle Used In This Force Sensor Test
The Pressure Waves. In graphs 7 to 11 you can see a kind of pressure wave where the pressure seems to go up and down like a sine wave. This has caused elements of the graph to lose consistency such as filament retractions and nozzle pressure.
We know that the pressure wave appears when the temperature is reduced because graphs 1 to 5 and 12 show no wave at all; despite the same test part being printed throughout. We also know that 3d printing at a higher speed does not produce the same wave effect because graph 12 pressure reading compares with graph 8 that has the wave.
On this 3d printer hot end the nozzle sticks out from the heater block by about 8mm which I think is plenty enough to cause a large temperature difference between the heater block and the nozzle tip. My guess is that when extra force is needed to extrude filament at lower temperatures the hot end pressure rises causing the nozzle tip to get hotter until it extrudes filament more quickly. As the filament extrudes more quickly the pressure starts to drop causing the nozzle temperature to drop. As the temperature drops in the nozzle the filament becomes more difficult to extrude causing the pressure in the hot end to rise again. I think this is a temperature rise and fall cycle the force sensor is detecting and producing the pressure wave in the graphs.
The Future. I think at the very least this filament force sensor technology could be used for benchmarking new hot ends. We probably should be seeing test results from the many new hot ends that are now appearing on the market to help our purchasing decisions. If the filament force sensor becomes popular it could certainly be used to help troubleshoot extruder problems with new hot ends fitted. The data collected from the filament force sensor could be used to better prepare new hot end for the market. Having new hot ends backed up with good filament force sensor data would help build customer confidence.
The extruder filament force sensor technology could redefine the reputation of bowden type extruder set-ups and the bowden set-up may even become more popular on 3d printers. The filament force sensor would provide an easy set-up and configuration procedure based on sensor feedback.
In the future the filament force sensor could be used to allow 3d printer firmware to calibrate itself to determining the best speed, the best temperature and the best retraction length settings. The firmware could also dynamically adjust the retraction distance when printing speed is adjusted on the front panel. This kind of 3d printer set-up could be the ideal thing for consumer level 3d printers.
The next post will be the guide to setting up the Airtripper Extruder Filament Force Sensor brackets and how to adjust the brackets to fit different load cells.


